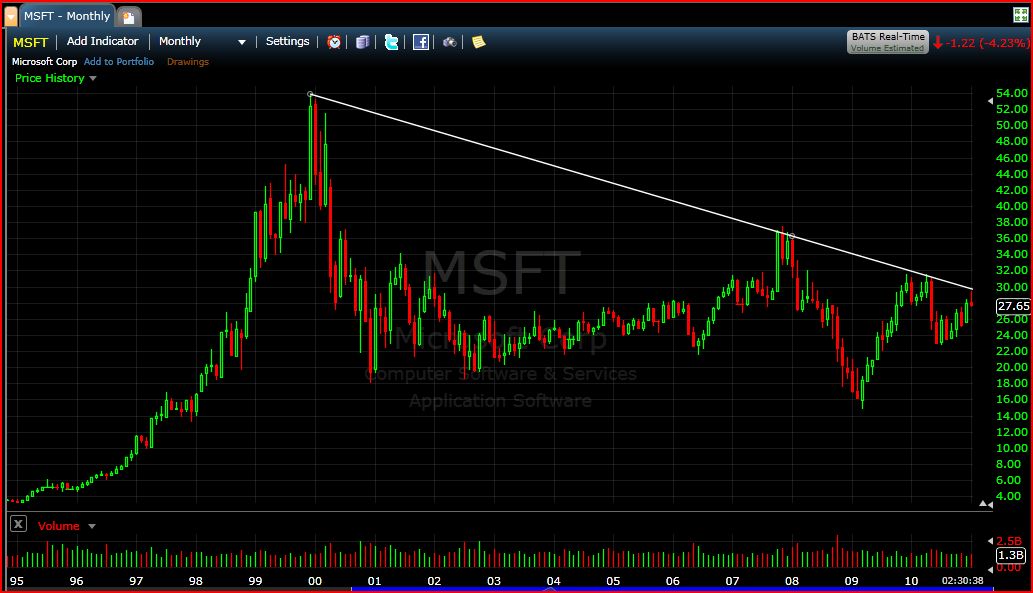
Still, if this breaks the downtrend line it could start moving significantly. Where to enter? Above 32 would be very conservative, entering the last few days aggressive (there was a breakout on the daily chart that failed), above 30 in the middle. After all, it has not broken the line yet, and may not for quite some time, but the duration of the tests are getting closer, looks pretty ripe to me.
If you are a pullback buyer, you could enter on touches of the 50 or 200dma's, draw fibs, of use your indicator of choice. I am a breakout player, mostly because I am impatient and want confirmation of a move rather that trying to anticipate and having consolidating stocks eat up my mental energy and my capital.
Once it breaks the line it can retest but spending anytime below it would be bearish. In clearer terms, if it gets above 32 I would not be happy to see it under 30 ever again.
Pretty chart and a simple plan.


No comments:
Post a Comment